Table of Contents
Slope and Intercept
The Slope and Intercept values describe a relation of the bottom micrometer step movement to the top micrometer step movement. The top micrometer movement per wavelength is determined by the dispersion file in use by the instrument.
Collecting Data to Determine Slope and Intercept
The GA routine is used to collect the GA file. It is suggested to collect multiple GA's to get an average.
NOTE: GA will over-write the file if there is already one created on the same day. If you want to have multiple GA in one day, you will need to rename the files each time. This routine will take about 30-45 minute to finish.
Processing the GA
Note: This standard operating procedure (SOP) is based on using Brewer Test Plots program (GA tab) to process a series of GA files, complete with the dispersion in use to collect an average Slope and intercept value. Only if the Slope or intercept value has changed significantly is any change applied. Brewer Test Plots is a software created by International Ozone Services (IOS) Inc.
- Open Brewer Test Plots and select the GA tab and check slits 1 and 5 and select a 7-position fitting.

- Select the dispersion in use while the GA measurement were taken for the instrument you are interested in. Note: do not use the cubic version of the dispersion file.

- Select the GA file that you want to process.

- Select the Simulated CI scan change tab.
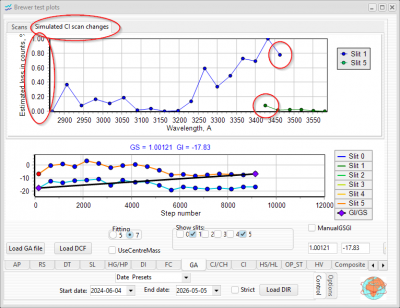
- To minimize losses at the lowest wavelengths and reduce the amplitude between the slit 1 measurements the black line in the lower graph can be manipulated primarily from the left end of the black line.
 In this case the left side of the black line was lowered slightly. Notice the effect. The percent loss in counts went from 0.2 – 0.4 % to 0.1-0.2%.
 - To lower losses at the highest wavelengths and reduce the amplitude between the end of the slit one measurement and the start of the slit 5 measurement, the black line in the lower graph can be manipulated primarily from the right end of the black line with minor adjustments on the left end to maximize the throughput of the signal.
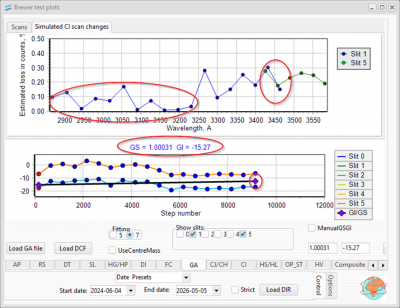 In this case, losses at the lowest wavelengths remain under 0.2% signal loss, while the overall loss is below 0.3%. This is an exceptional instrument. The loss value is somewhat dependant on how well the top and bottom mirror alignment agree with each other and if there are some slight differences in alignment the losses can be 1-2% (or slightly more) but still be acceptable.
 - The circled GS/GI value circled are the values we are interested in. Since these scans will not provide an identical response every time multiple file should be process.
- Record the GA result in a table and step 1 with a new GA file until you have a few GA processed.


| File Name | Slope | Intercept | Maximum estimated % loss in counts over measurement range | |
| Original values | 0.99730 | -3.50 | 1.89 | |
| New Values | GA11426.190 | 1.0031 | -15.27 | 0.3 |
| GA11626.190 | 0.99974 | -11.29 | 0.6 | |
| GA11826.190 | 1.00000 | -14.84 | 0.30 | |
| GA11926.190 | 1.0033 | -14.70 | 0.5 | |
| Mean Value | 1.001535 | -14.025 | 0.425 | |
| % diff from previous | 0.3% | 282% | 1.37% |